Abnormal user identification in substation area based on restricted ridge regression model
XinGang Du
Harbin Institute of Technology
State Grid Corporation of China Co., Ltd;Beijing;100031
Email: xingang-du@sgcc.com.cn
Bing Zhao
Beijing University Of Technology in 2002
China Electric Power Research Institute Co., Ltd;Beijing;100192
Email: bzhao@epri.sgcc.com.cn
DeHui Ge
Xi'an Jiaotong University
China Electric Power Research Institute Co., Ltd;Beijing;100192
Email: dehui-ge@sgcc.com.cn
YaJie Li
PLA Information Engineering University in 2007 (Now renamed the Information Engineering University )
State Grid Corporation of China Co., Ltd;Beijing;100031
Email: jls-liyajie@epri.sgcc.com.cn
Abstract: In order to further improve the identification accuracy of power metering anomalies, a user identification method for substation area anomalies is designed based on the restricted ridge regression model. Firstly, a clustering algorithm is designed using high-frequency voltage data of users in the substation area to conduct phase separation and terminal branch identification for each user metering point in the substation area. Then establish a substation area energy conservation model equation set, and merge the end branch users based on genetic algorithm clustering results, thereby reducing the unknown quantity dimension. Then, a line resistance constrained condition is constructed using the topological structure, and the model equation set is solved using quadratic programming based on the constrained ridge regression method to obtain the measurement point error results of users in the substation area. The experimental results show that the clustering effect and recognition accuracy of this recognition method are high, with a recognition rate of 98.21%. It can be seen that this abnormal user identification method has application value.
Key words: Restricted ridge regression model; Substation area abnormality; Abnormal user identification; User classification; Clustering distance;
Chinese Library Classification No.: TM712 Document Identification Code: A
1. Introduction
The accuracy of electricity metering is related to the vital interests of both power suppliers and consumers. Accurate evaluation of the operating status of electricity meters is an important standard to measure the management level of power companies. The smart electricity meter in the advanced measurement system, as the core of electricity metering, can obtain real-time (or quasi real-time) detailed various electric energy metering data from users on a regular or real-time basis, laying the foundation for smart grid big data analysis. Currently, smart grids in most regions of China can achieve full coverage of smart electricity meters, accompanied by data driven and real-time status evaluation of smart meters, and it can also be monitored throughout the entire process through a data terminal. As the management requirements of electric power companies become more sophisticated, the requirements for status evaluation also become increasingly high, which means that the accuracy requirements for identifying abnormal users in the substation area become higher.
In response to the above problems, it is necessary to design a method for identifying abnormal users in the substation area. Among the existing identification algorithms, literature [1] takes the non-technical power consumption behavior of the power grid as the basic goal of testing, It synthesizes the data from the user’s power consumption side, extracts the user’s power consumption characteristics, and establishes a classification model based on various algorithms, and then classifies the converted user’s power consumption characteristics to determine whether they belong to abnormal behavior. Literature [2] proposes a user identification method based on the AR/ARCH model of autoregressive/autoregressive conditional heteroscedasticity. Under given parameter estimation indicators, the degree of identification correlation is designed, and it is validated and analyzed under a multi-layer framework. In Literature [3], a user computing and identification method based on clustering division and bidirectional LSTM networks was designed with the goal of improving the work efficiency of the substation area. This method combines static parameter characteristics to divide different categories of user behavior, and constructs a computational model. The classification results obtained have high accuracy. Based on the above literatures, this paper designs a new method for identifying abnormal users in the substation area, which is based on the restricted ridge regression model to identify abnormal users within the substation area.
2. Abnormal user identification in substation area based on restricted ridge regression model
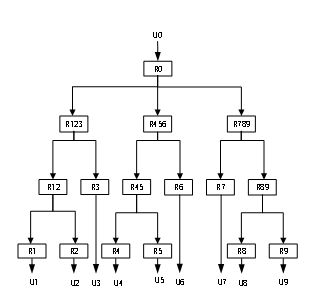
Before obtaining abnormal user identification results, it is necessary to first use a clustering algorithm , and use high-frequency voltage data of users in the substation area to perform phase separation and terminal branch identification for each user metering point in the substation area. Then establish a substation area energy conservation model equation set, and merge the end branch users based on genetic algorithm clustering results, thereby reducing the unknown quantity dimension. Finally, the topological structure is used to construct a line resistance constrained condition. Based on the constrained ridge regression method, the model equation set is solved using quadratic programming to obtain the measurement point error results of users in the substation area. Establish a schematic diagram of the line topology of the low-voltage substation area, as shown in Figure 1.
Figure 1 Schematic Diagram of Substation Area Line
In Figure 1, U0 represents the total meter voltage, while U1,..., and U9 represent the voltage at the user’s location respectively (which can also correspond to user metering points). It can be seen that users 1 and 2, 4 and 5, 8 and 9 belong to the same end branch respectively [7].
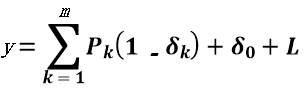
Starting from the substation area line topology diagram of Figure 1 , the energy conservation expression under the low-voltage substation area can be obtained as follows:
 |
(1) |
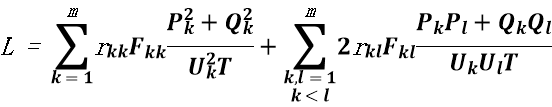
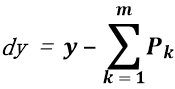
Where, y represents the total meter power supply in the substation area,represents the relative error of the k-th metering point in the substation area, k=1,2,..., m, m represents the number of metering points in the substation area,represents the active power metering value of the metering point k,represents the fixed loss in the substation area, and L represents the line loss in the substation area [8-10]. The line loss L can be further expressed as follows: Starting from the topology diagram of Figure 1, based on the line structure of the substation area, the mathematical induction method is used to model and process the line loss in the substation area. Under the premise of ignoring the terminal branch voltage phase difference, the line loss L in the substation area can be expressed as:
 |
(2) |
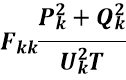
Where,and respectively represent the line resistance (hereinafter referred to as independent line resistance) from the terminal branch of the substation area line to the total meter and the line resistance (hereinafter referred to as cross line resistance) from the shared branch of the substation area line to the total meter, which are undetermined constants [11-13];and respectively represent the adjustment coefficient from the end branch of the line to the total meter and the shared adjustment coefficient from the shared branch of the substation area line to the total meter. The adjustment coefficient can be obtained through the user’s electricity consumption behavior;and respectively represent the active and reactive power metering values of the metering point k;represents the voltage at the metering point k, and T represents the metering period, typically 15 minutes. Substitute (2) into (1) to obtain the energy conservation equation under the substation area. After accumulating sufficient data, the energy conservation equation set can be established. The equation set is linear, where the unknown quantities are the relative error of the metering points,independent line resistance, cross line resistance, and fixed loss.
2.1 Terminal Branch Recognition Based on Genetic Algorithms
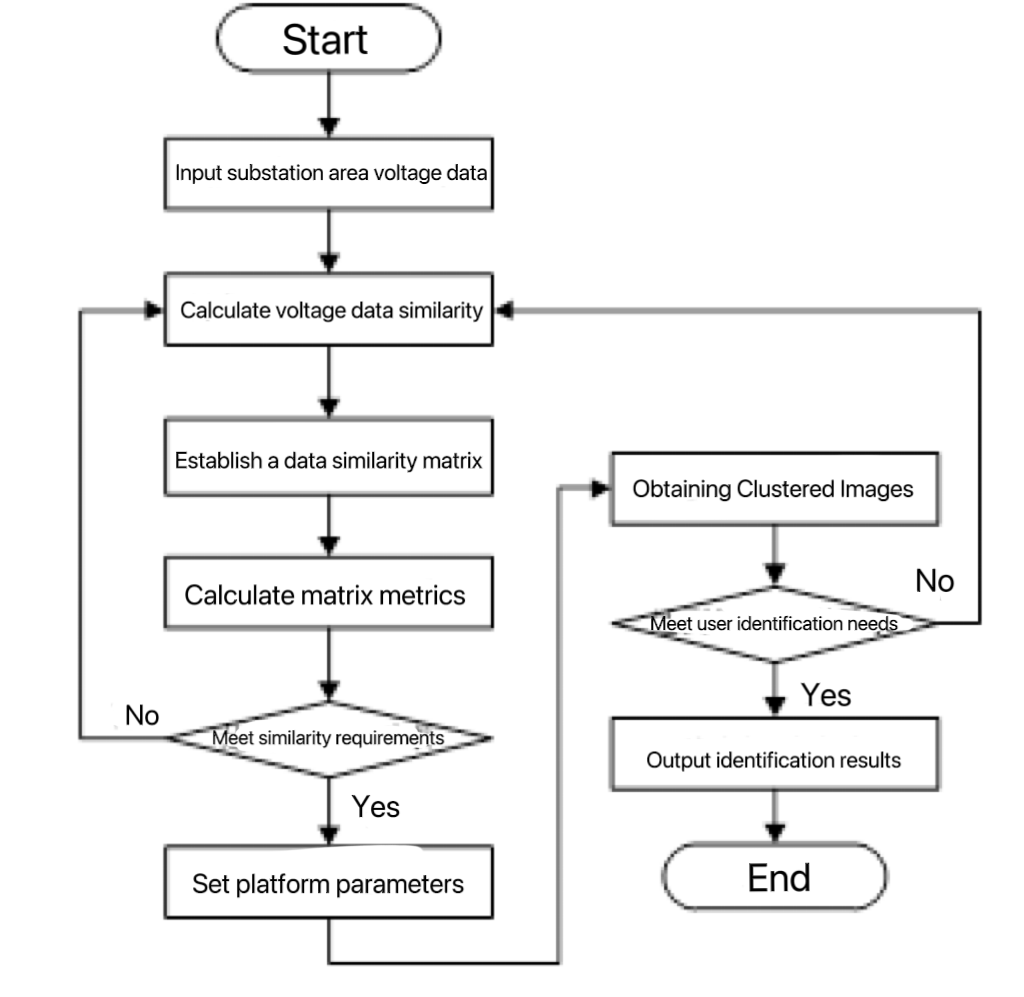
From expression (2), it can be seen that for a substation area with a scale of m, there are a total of unknown quantities of line resistance, and is the combination number. In order to facilitate the model solution, it is necessary to use high-frequency voltage data of users in the substation area to perform phase separation and terminal branch identification on user metering points, thereby reducing the dimensions of line resistance unknown quantities in the model equation set [14-16]. Based on this, we can design a genetic algorithm based algorithm for terminal branch recognition in the substation area, as shown in Figure 2.
Figure 2 Genetic Algorithm Clustering Process
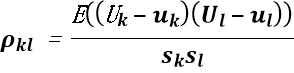
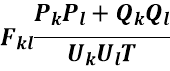
As shown in Figure 2, in this algorithm, it is first necessary to input the corresponding substation area voltage data, and calculate the similarity and matrix metrics of the voltage data. Wherein, the similarity is measured using Pearson correlation coefficients, which are calculated using the following formula:
 |
(3) |
Where,represents the Pearson correlation coefficient between user k and user l;and respectively represent voltage data for two users in the substation area;and respectively represent the expected values of voltage data;and represent the overall standard deviation of voltage data [17]. According to formula (3), the correlation between two sets of voltage data can be quantized and a data similarity matrix can be established. Then calculate the clustering distance according to formula (4):

(4)
Where,

indicates the clustering distance between two sets of data. When the clustering distance is above the standard value, it indicates that the similarity requirement is met;and respectively represent the positions of two samples to be clustered [18-20]. When the clustered image meets the user identification requirements, the identification result can be output, which is the user identification result of the terminal branch of the substation area based on genetic algorithm.
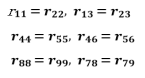
Based on the above clustering results, terminal branch users of the substation area topology can be merged. As shown in the substation area topology diagram in Figure 1, users 1 and 2, 4 and 5, 8 and 9 can be merged separately, so their corresponding line resistances can be set to the same, that is
2.2. Abnormal user identification in substation area based on restricted ridge regression model
In the process of identifying abnormal users in the substation area, in order to obtain relevant parameters more scientifically, it is necessary to use a restricted ridge regression model to solve the equation (1). First of all, note that there is a certain magnitude relationship between the line resistance based on the topology of the substation area. As we have known before, the independent line resistance represents the sum of all line resistances from the terminal branch of the substation area line to the total meter,while the cross line resistance represents the line resistance of the common part of the line from the shared branch of the substation area line to the total meter. Therefore, the line resistance coefficients directly have the following relationship:
 |
(5)
(6) |
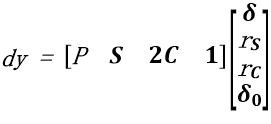
Secondly, substitute (2) into (1) and change it into a block matrix as follows:
 |
(7) |
Wherein, each component of represents the statistical line loss per data acquisition cycle, i.e
It is not difficult to map the coefficient blocks in the first matrix on the right side of Equation (7) to (1). For example, P represents the opposite number of active power for each user, S represents the coefficient corresponding to the independent line resistance portion, that is, each component of S corresponds to
, each component of C corresponds to
, and constant vector 1 is the coefficient of a fixed loss term;The second column vector on the right side of the equation (7) represents an unknown vector, that is,is the measurement point error sequence,is the sequence corresponding to the independent line resistance term,is the sequence corresponding to the line resistance cross term,andis the fixed loss.
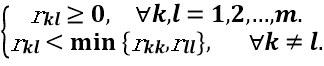
Next, the principle of the restricted ridge regression method can be derived: When solving equation group (7), the measurement point error is penalized (ridge regression regularization), and the line resistance unknown quantities and are linearly restricted (restricted) based on physical topology, that is, all line resistance coefficients are not less than 0 (restriction condition (5)), and the cross line resistance is less than the corresponding independent line resistance (restriction condition (6)). While regularizing the unknown quantity in equation (7) with a ridge regression factor of is equivalent to solving the least square solution of the following equation group (8):
 |
(8) |
Where I represents the identity matrix.
To sum up, solving a ridge regression solution constrained by conditions (5) and (6) of equation group (7) is equivalent to solving a least square solution of equation group (8) that satisfies constraint conditions (5) and (6). This problem can be solved using quadratic programming.
3.Experimental verification
3.1 Terminal Branch Identification
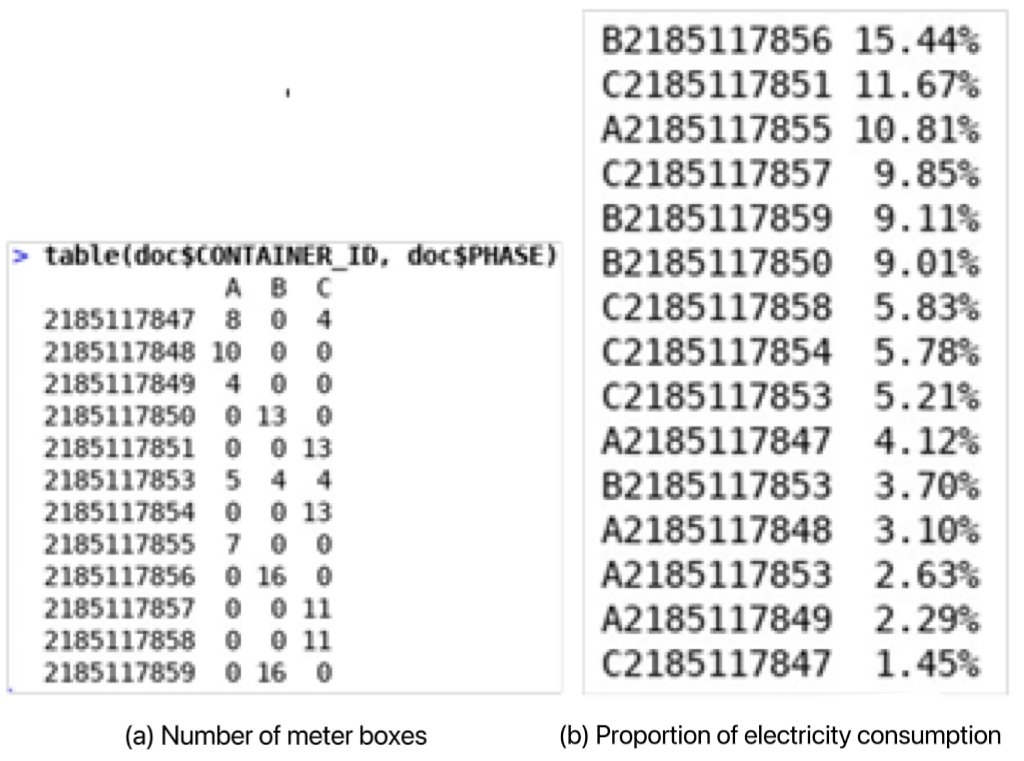
To test the effectiveness of the restricted ridge regression model developed above, the following experiments were designed for analysis and testing. Collect the high-frequency data from a certain substation area for a total of 26 days from May 20, 2020 to June 14, 2020, including a total of 139 sub meters, and the total meter is a four digit reading. The original data has 2496 data points (96x26), but there are many abnormal points in the total meter and sub meters. After removing the abnormal points, 2129 data points are used. Of the 139 sub meters, 11 electricity meters have no power consumption at all, and another 9 electricity meters have a total electricity consumption of less than 1 kilowatt hour. Remove them. In the final available data set, the total reading of the total meter is 9122.96 degrees, the total reading of the sub meters is 8857.81 degrees, the difference is 265.15 degrees, and the overall line loss rate is 2.91%. After clustering by genetic algorithm, the substation area includes a total of 12 terminal branches, and the combination number of phase-terminal branches is 15. That is, the distribution of user numbers and power consumption proportion in the terminal branches of the substation area is shown in Figure 3.
The above results show that after clustering analysis with genetic algorithms, the number of line resistance unknown quantities in this substation area has been reduced from to, greatly reducing the dimensions of line resistance unknown quantities, thereby transforming the model from an underdetermined equation group to an overdetermined equation group, which is conducive to the solution of the model.
Figure 3 Distribution of user numbers and proportion of electricity consumption in terminal branches
3.2 Effect of restricted ridge regression solution
In order to verify the detection ability of the recognition model, four substation areas were selected as pilot sites on the site, and genetic algorithm clustering was used to obtain power consumption information as shown in Figure 3. Adjust the power consumption of the metering poinst in simulation data and real data to simulate the out-of-tolerance of the metering points, and the blind test verification results are obtained, as shown in Table 1.
Table 1 Verification Results of Blind Test
|
Data |
Substation area number |
|
001 |
002 |
003 |
004 |
|
Simulation data |
Positive |
55 |
53 |
56 |
54 |
|
Negative |
53 |
54 |
54 |
53 |
|
Positive or negative |
52 |
56 |
53 |
53 |
|
Both |
50 |
52 |
50 |
52 |
|
Hit rate |
100% |
100% |
100% |
100% |
|
Detection rate |
96.5% |
98.6% |
97.4% |
96.8% |
|
Real data |
Positive |
38 |
37 |
38 |
34 |
|
Negative |
39 |
39 |
37 |
36 |
|
Positive or negative |
37 |
36 |
39 |
38 |
|
Both |
36 |
35 |
37 |
32 |
|
Hit rate |
98.3% |
97.4% |
96.2% |
97.8% |
|
Detection rate |
68.9% |
67.6% |
65.3% |
63.7% |
The data in Table 1 represents the number of out of tolerance metering point hits, while the “positive”/“negative” in Column 2 represent the number of positive out of tolerance simulation hits and negative out of tolerance simulation hits, respectively. The “positive or negative” represents the number of one-way adjustment hits, and the “both” represents the number of both positive and negative adjustment hits. From the blind test verification results in Table 1, it can be seen that the hit rate and detection rate of the model in the simulation data have reached a high level. In blind testing of real substation area data, the detection rate is generally lower than that of the simulation data due to the serious impact of reality on the data itself (such as clock misalignment, data acquisition anomalies, etc.), but its hit rate already has extremely high engineering guidance significance.
3.3 Comparison with existing algorithms
Combining several other different algorithms, such as Stacking integration structure under Dissimilarity Models, Cluster partitioning and bidirectional LSTM network, and Autoregressive conditional heteroscedasticity model, we compare them with the method in this paper ,and the recognition rates of different methods are obtained, as shown in Table 2.
Table 2 Recognition rate test of different algorithms
|
Recognition algorithm |
Total number of anomalies |
Recognition number |
Recognition rate/% |
|
Restricted ridge regression model |
56 |
55 |
98.21 |
|
Stacking Integration Structure under Dissimilarity Models |
26 |
23 |
88.46 |
|
Autoregressive conditional heteroscedasticity model |
35 |
32 |
91.42 |
|
Cluster partitioning and bidirectional LSTM networks |
75 |
70 |
93.33 |
Compared to the above several abnormal user recognition algorithms, the recognition rate of the algorithm in this paper is 98.21%, while the recognition rates of other algorithms are 88.46%, 91.42%, and 93.33%, respectively. It can be seen that the recognition accuracy of the method in this paper is significantly higher than other methods.
4. Conclusion
This paper designs a method for identifying abnormal users in the substation area based on the restricted ridge regression model. Compared with other algorithms, the recognition rate of this method is above 98% and the recognition accuracy is high. In the next stage of research, in-depth research and classification can be conducted for specific fault types such as power theft and three item imbalance, and real-time optimization of the algorithm can be conducted.
References
[1] Cheng Chaopeng, Peng Xiangang, Zeng Yongbin, et al. Abnormal power consumption user identification method for Stacking integrated structure under dissimilarity models [J]. Power Grid Technology, 2021,45 (12): 4828-4836
[2] Feng Heng, Gao Bin, Guo Huiyong. Nonlinear damage identification and experimental study of transmission towers based on autoregressive/autoregressive conditional heteroscedasticity model conversion distance [J]. Industrial Architecture, 2022,52 (08): 57-63
[3] Wang Peng, Bai Yuling, Wang Linmei, et al. Calculation of substation area line loss rate based on cluster partitioning and bidirectional LSTM network [J]. Electronic Devices, 2022,45 (04): 964-969
[4] Shi Zhipeng, Wang Huinan, Wang Chanqiong, et al. Research on optimization technology for substation area maintenance decision-making based on line situation awareness [J]. Power Grid and Clean Energy, 2022,38 (09): 89-97
[5] Chen Guangyu, Xu Jiajie, Lu Zhaojun, et al. Detection and accurate positioning of line loss anomalies in substation areas based on correlation metric algorithms [J]. Electric Power Engineering Technology, 2022,41 (04): 67-74
[6] Yuan Ke, Huang Yabing, Du Zhanfei, et al. Block cipher algorithm identification scheme based on mixed gradient lifting decision tree and logical regression model [J]. Engineering Science and Technology, 2022,54 (04): 218-227
[7] Lin Baode, Yang Zhengyu. Research on Anomaly Identification of Line Loss Data in Power Grid Substation Areas Based on Multidimensional Characteristics [J]. Power System Protection and Control, 2022,50 (09): 172-178
[8] Ge Dehui, Hua Dingzhong, Wang Qi, et al. Analysis method of abnormal operating conditions in low-voltage substation area based on virtual loop impedance [J]. Power System Automation, 2022,46 (13): 104-111
[9] Wan Diming, Sun Haiyu, Zhang Xiaofei, et al. An online verification method for link relationships in substation area gateway meters based on Tree Enhanced Eaive Bayesian Elassification [J]. Electronic Devices, 2021,44 (06): 1463-1468
[10] Lu Shuang, Peng Shurong, Yang Yunhao, et al. Abnormal photovoltaic user identification method based on average impact value-heuristic forward search [J]. Electric Power Automation Equipment, 2022,42 (02): 106-111
[11] Tang Jie, Yang Yin, Liu Siliang, et al. An online optimization method for substation area phase sequence based on improved SVM and NSGA - Ⅲ [J]. Power System Automation, 2022,46 (03): 50-58
[12] Yang Jian, Zhou Yatong, Liu Jun. Application of BiLSTM and TCN in the identification of abnormal household change relationships [J]. Journal of Electric Power System and Automation, 2022,34 (05): 1-10
[13] Yu Bo, Wang Zhihai, Sun Yadong, et al. Sensitive data recognition and abnormal behavior analysis for unstructured documents [J]. Journal of Intelligent Systems, 2021,16 (05): 932-939
[14] Li Keming, Jiang Yaqun, Huang Shifu, et al. Identification method of low-voltage topology structure in distribution substation areas based on DTW distance and clustering analysis [J]. Power System Protection and Control, 2021,49 (14): 29-36
[15] Hou Fengyi, Jiang Xiaoying, Xu Dinghua. Regularization method and empirical analysis of parameter identification in MRW model[J]. Journal of Fudan University (Natural Science Edition), 2019,58 (06): 671-677
[16] Hou Enke, Feng Dong, Wen Qiang, et al. Research on the Logistic Regression Analysis Method for Identifying the Source of Mine Water Inflow [J]. Mining Safety and Environmental Protection, 2019, 46 (06): 77-83
[17] Li Lanfang, Li Xin, Huang Jiajian, et al. Data analysis of low voltage substation area formation based on forward and backward substitution method [J]. Electromechanical Information. 2019, (12): 1-3
[18] Chen Hao, Qiao Yanan, Liu Jing, et al. A method for analyzing the operation error of intelligent electricity meters considering the ill condition of models [J]. Electric Power Construction, 2020,41 (02): 94-100
[19] Zhang Bo, Ma Yifeng, Ren Min, et al. Data Correction and Data Mining Analysis for Operating Error of Low-voltage Substation Area Electric Energy Meters [J]. Automation and Instrumentation, 2020,35 (11): 15-19
[20] Chen Xiao, Wang Liming, Ji Xinrong, et al. A monitoring model for operating error of electric energy meters based on high-speed carrier communication and high-frequency data acquisition [J]. Electrical Automation, 2021,43 (05): 79-81+85